
Knowledge is power.
I even apply that philosophy to my fitness and nutrition goals.
Since embarking on VI last year, I have kept meticulous records which have literally saved me from backsliding or giving up. They serve as a record void of emotion where I can study trends and data mine.
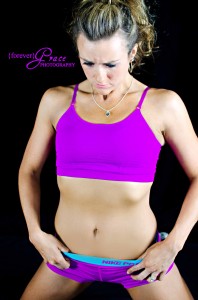
Liss after 1 year of VI and still going strong. Photo by {forever} Grace Photography
The most recent example of when my records came into play was to answer a question that John Barban posed in the community- “Do you have any problematic foods- specifically foods that bloat you or any you have trouble with?” I randomly bloat 3.5-5.0 lbs overnight at times, and I wondered if I could trace it back to any particular food.
So out came the records.
- First, I identified each day in the past 4 months that I had a huge weight spike (3.5 lbs+).
- Then, I went back and looked at specifically-
- what foods that I ate on those days,
- how many calories I ate, as well as
- daily macro-nutrients
- and sodium intakes.
- What I found was that it was not a particular food but a carbohydrate or sodium spike (compared to my normal intake) that would cause this massive bloating. I would have never known this unless I had my records to refer back to.
What Data is Worth Keeping?
I now have data in 3 major places- a physical notebook, Sparkpeople.com, and a Microsoft Excel spreadsheet. Some data is quite useful while other pieces are only useful on occasion. I prefer to have more than enough data, because I like to know that it is there to refer back to when I need it and it is not like you can go back and take it. I think of my data collection as my “lab notebook” in the experiment of me.
What data is kept where?
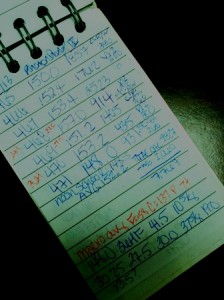
My metrics notebook
1. Physical notebook
- Date (and fasting hours, if any)
- Weight
- Calorie count
- Exercise (and caloric burn estimate)
- Fasted weekly metric- shoulder, right bicep, ribcage, waist, navel, hips, right thigh, right calf, (sometimes neck)
- Weekly weight average
- Weekly calorie total
- Weekly exercise burn total
- Weekly average of daily macro-nutrient totals (carbohydrates, protein, fat)
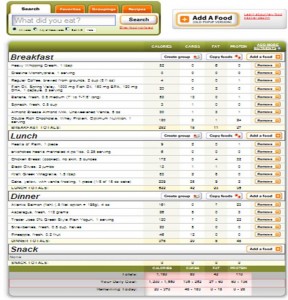
Sparkpeople.com is an easy place to keep food and exercise logs
2. Sparkpeople
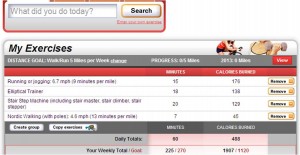
An exercise log at Sparkpeople.com
- Daily food log by date (calories, macronutrients)
- Weight
- Exercise
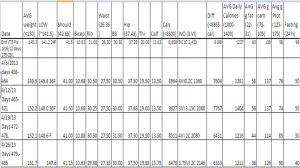
An example of one of Liss’ many Excel spreadsheets
3. Excel spreadsheet
- Date range
- Weekly avg weight
- Weekly fasted weight and metrics
- Weekly calorie total
- Weekly exercise burn
- Weekly deficit
- Weekly hours fasted
- Weekly avg of daily protein intake
- Some tabs with charts of weight and metrics over time, such as caliper data
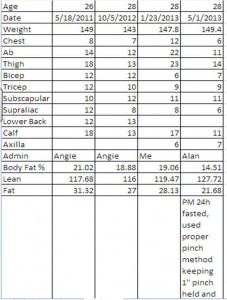
Caliper data in Excel
Why repeat data in multiple locations?
For example, my weight is entered in multiple locations- my notebook and Sparkpeople. Why do I repeat some data in multiple locations? Since Sparkpeople is online, and I live in the middle of nowhere, sometimes internet accessibility (even on my smart phone) is limited. I can easily write my daily weigh in on my notebook where ever I am. But by putting my weight into Sparkpeople, it is easy to export the data into Excel to graph it when I need it. Sparkpeople and Excel also serve as a backup in case my notebook is lost or destroyed.
I enter my weekly data and averages into Excel to easily pick out trends and patterns that become obvious when numbers are in a neat line. Again, graphing and analyzing trend lines is easier to do in Excel. As you look at data over time, you realize what is the most efficient way for you to keep up with your data. These are some ways that work for me.
Ways that I use data daily:
I add up my calorie totals to see if I am on track to meet my total calorie goal for the week. I can recalculate daily calorie goals if needed or throw in a fast day if the week is looking like it might be going sideways.
Weekly:
I like to use the data that I collect to keep on track with my current goals. My current goals are:
1. Live at VI metrics
2. Eat an adequate amount of protein so that muscle growth is not inhibited
As a by product of goal 1, I have underlying goals that I need to meet in order to be in a caloric deficit to lose enough fat/ build enough muscle to be at VI, in an everyday unfasted state. These goals include-
3. Get a minimum of 3 VI workouts in per week
4. Eat a maximum of 8,000 calories a week (This is a deficit for me)
5. Fast for a minimum of 24 hours (helps with meeting goal 4 and seeing exactly where my body is each week without water/food “noise”)
6. Get in 2 hours of cardio per week
So by putting my weekly weight average, fasted metrics, calorie total for the week, daily protein average, and exercise totals on a spreadsheet- I can see if I met my weekly goals to make sure that I am on track. These things are just a reflection of my underlying goals. Again- the things that I track are a reflection of my goals. This also keeps me from getting my goals hijacked, and helps me focus on things that matter instead of noise. If I am going the wrong direction (away from my goals), it becomes blatantly apparent. Trends become very apparent at this point when you see weeks sitting side by side.
Periodically:
I will graph my avg weekly calorie intake (or weekly calorie deficit which includes workouts) and compare it to my weight loss over time. This gives me a more personalized look at what weekly calorie/workout totals that I lose best at- both mentally and physically. It also gives me an idea of what type of deficit is sustainable for me because it is easy to see calorie spikes. If you are in maintenance mode, you can also see if your weight or metrics are trending up or down and make necessary adjustments to even it out. After all, calorie intake is highly individualized- nobody but you has your specific needs.
Another helpful periodic check is body fat levels, DXA data is the gold standard but I also keep up with caliper data on a tab in my Excel spreadsheet. This keeps this metric data in one convenient place so I do not have to chase down paper reports.
Keeping Emotion in Check
Sometimes after a big weekend, it is hard for me to get on that scale Monday morning and see the damage. But I need the data. It is just data, after all. (It also serves as my reality check, but that is beside the point!) This is part of the overall change that has taken place in my life with VI- it is a lifestyle now. I keep at it, all the time. It is a part of how I live now.
Five years ago, I would have freaked out after I got the scale that morning and threw in the towel for a few weeks- starting another vicious cycle of weight gain. But now, after seeing so many particularly high Monday mornings, I have finally realized that I just need to get back on the horse and hit my nutrition and workout goals all week. I am usually fine by Thursday at the latest. This is just one personal pattern that I have found, which makes getting on the scale Monday morning not as bad anymore. Knowledge is power.
Why Record Data? A Summary
- While it looks like some work on the front end, keeping good nutrition and fitness records can actually make reaching your goals easier.
- It will help you to easily review what is working and not working for you which will make choosing adjustments easier.
- It helps focus on your goals, and block out “goal hijacking noise”
- It also takes the emotion out of the equation, and forces you to look at the logical aspects of the numbers.
- It also helps keep me accountable, and has become a habit which helps me identify if I am potentially backsliding.
So in the end the data helped me solve the problem regarding bloating with sodium and carbohydrates. It also helps me set personalized calorie needs each week. Data collection might be something for you to consider if you are trying to solve a problem. It might even help you stay on track with your goals.
-Liss
You are awesome Liss 🙂
~ Liss, definitely, knowledge is power….. everyday, since the day we met, I learn from you, that learning helps me keep my weight under control,… this article is no different. Thanks for being such an inspiration….
You are an inspiration! Love your dedication to a healthy lifestyle! It is rubbing off on me! 🙂